-
Class Summary Class Description ChartComponent The top level component for displaying chartsChartUtil A utility class for painting a chart onto a Graphics context.
Package com.codename1.charts Description
The main ChartComponent Package
The charts package enables Codename One developers to add charts and
visualizations to their apps without having to include external libraries or embedding web views.
We also wanted to harness the new features in the graphics pipeline to maximize performance.
Device Support
Since the charts package makes use of 2D transformations and shapes, it requires some of the graphics features that are not yet available on all platforms. Currently the following platforms are supported:
- Simulator
- Android
- iOS
Features
- Built-in support for many common types of charts including bar charts, line charts, stacked charts, scatter charts, pie charts and more.
- Pinch Zoom - The
com.codename1.charts,ChartComponentclass includes optional pinch zoom support. - Panning Support - The
com.codename1.charts,ChartComponentclass includes optional support for panning.
Chart Types
The com.codename1.charts package includes models and renderers for many
different types of charts. It is also extensible so that you can add your own chart types if required.
The following screen shots demonstrate a small sampling of the types of charts that can be
created.
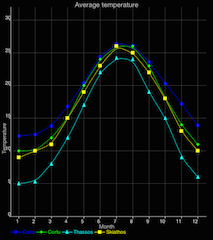
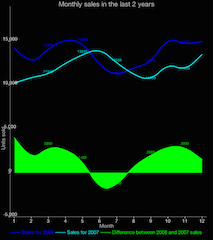
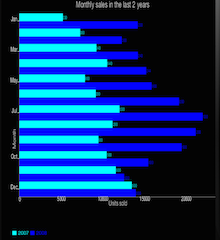
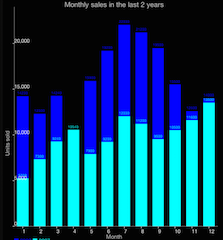
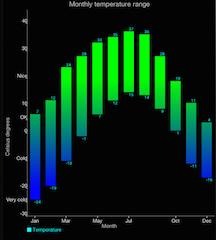
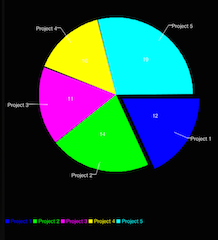
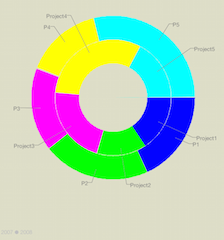
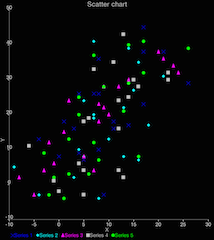
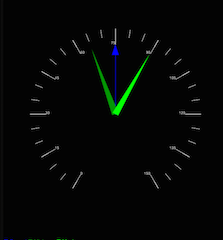
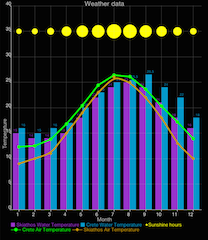
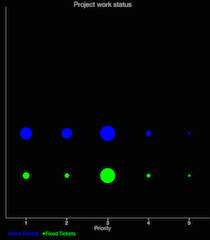
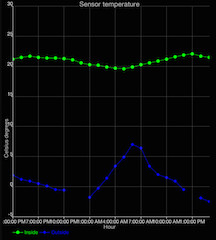
| The above screenshots were taken from the ChartsDemo app. Y ou can start playing with this app by checking it out from our git repository. |
How to Create A Chart
Adding a chart to your app involves four steps:
- Build the model. You can construct a model (aka data set) for the chart using one of the
existing model classes in the
com.codename1.charts.modelspackage. Essentially, this is just where you add the data that you want to display. - Set up a renderer. You can create a renderer for your chart using one of the
existing renderer classes in the
com.codename1.charts.rendererspackage. The renderer allows you to specify how the chart should look. E.g. the colors, fonts, styles, to use. - Create the Chart View. Use one of the existing view classes in the
com.codename1.charts.viewspackage. - Create a
com.codename1.charts,ChartComponent. In order to add your chart to the UI, you need to wrap it in acom.codename1.charts,ChartComponentobject.
You can check out the ChartsDemo app for specific examples, but here is a high level view of some code that creates a Pie Chart.
The charts package is derived work from the excellent open source aChartEngine API.